
TRG TRG Pakistan short term analysis 21st Sep. 2020
Rebound Insight
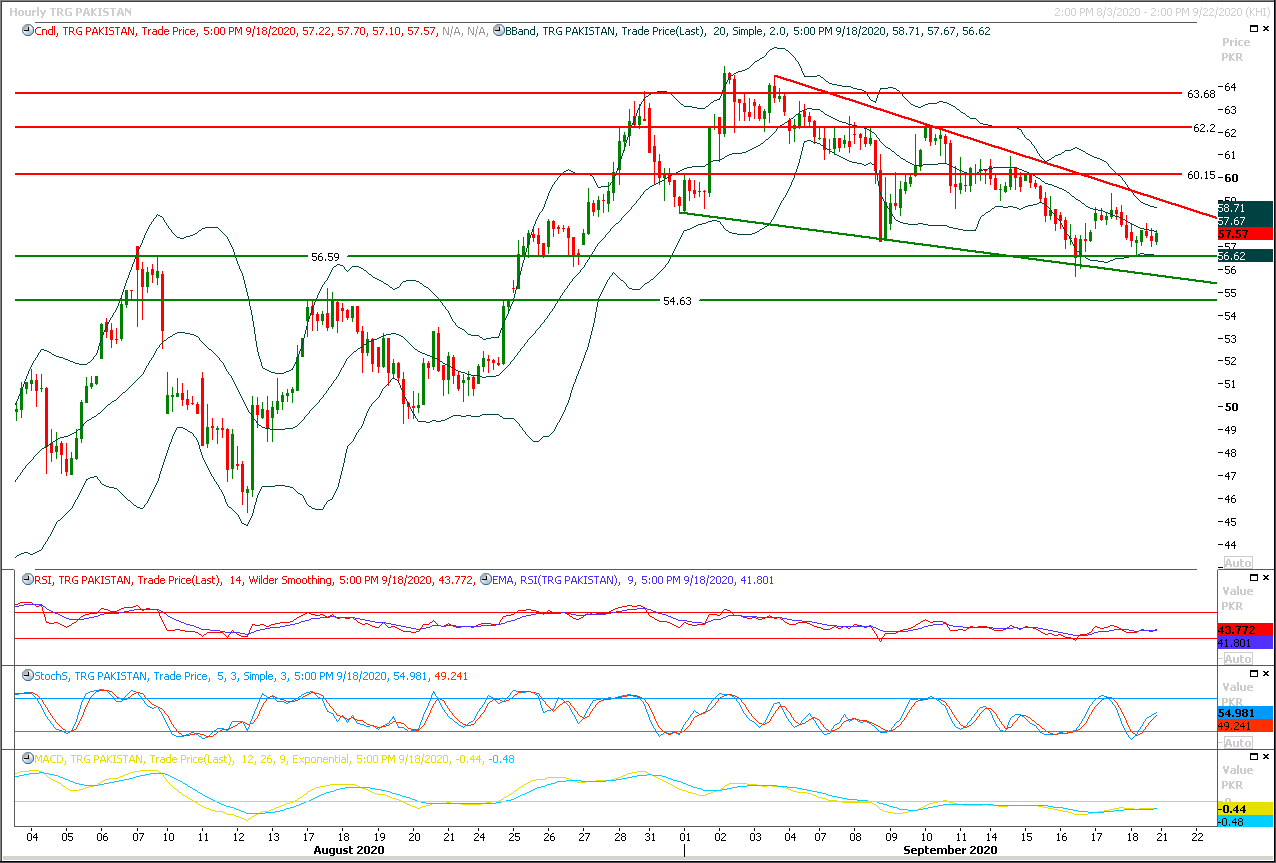
Our Pivot: 54.60
Our Preference: Start buying TRG from current price and average it out till 56.50 with strict stop loss of 54.60 and profit target at 60.00 with extension towards 62.20 and 63.70.
Alternate Scenario: Downward penetration of 54.60 will call for 51. and 49.
NOTE: TRG is moving a descending wedge on hourly chart and after getting support form supportive trend line of this wedge and a horizontal supportive region its ready for a bullish pull back of this wedge.
Hourly chart with supports & resistances:
TRG 42
Overview
Quick Snapshot
Free Float
463,582,065
O/S Shares
545,390,665
Market Cap. (m)
0.00
Var Value
16.50
Hair Cut
22.50
Last Price
Price Adjusted
52 Weeks Range
52w Low
52w High
Intraday
Pivots
| Level | 1st | 2nd | 3rd | Supports | 0.00 | 0.00 | 0.00 | Resistances | 0.00 | 0.00 | 0.00 |
|---|
Adjusted
Price Performance
Time Frame
Price Ch
%Ch
MTD Price Return
5.55
7.21
QTD Price Return
5.55
7.21
3M Price Return
-11.43
-12.16
6M Price Return
-47.43
-36.48
9M Price Return
-87.44
-51.43
YTD Price Return
-35.33
-29.97
1Y Price Return
-79.93
-49.19
3Y Price Return
62.12
303.77
5Y Price Return
35.06
73.79