
FFC Fauji Fertilizer Company Mid Term Analysis 01 Sep. 2017
Rebound Insight
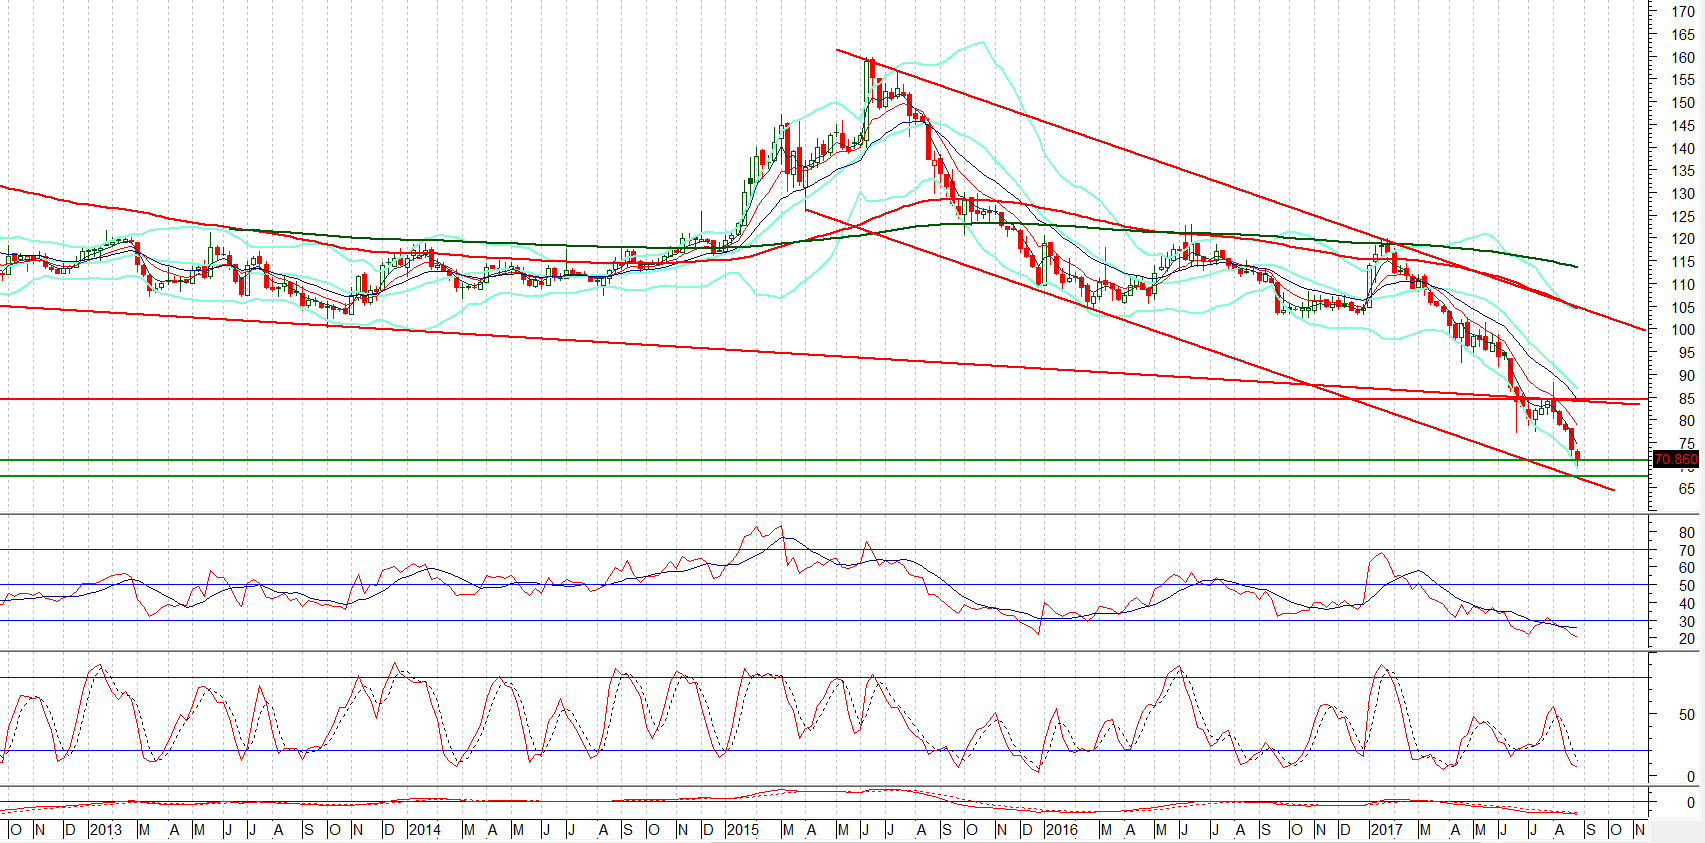
Our Pivot: 67.00
Our Preference: Start buying from 71.00 with strict stop loss of 67.00 and profit target at 83.87 and 84.42.
Alternate Scenario: Downward penetration of 67.00 would call for 64.70.
NOTE: FFC is Supported by a rising trend line and a horizontal supportive region.
Weekly chart with supports and resistances:
FFC 6
Overview
Quick Snapshot
Free Float
699,731,036
O/S Shares
1,272,238,147
Market Cap. (m)
0.00
Var Value
10.50
Hair Cut
15.00
Last Price
Price Adjusted
52 Weeks Range
52w Low
52w High
Intraday
Pivots
| Level | 1st | 2nd | 3rd | Supports | 0.00 | 0.00 | 0.00 | Resistances | 0.00 | 0.00 | 0.00 |
|---|
Adjusted
Price Performance
Time Frame
Price Ch
%Ch
MTD Price Return
11.11
9.89
QTD Price Return
11.11
9.89
3M Price Return
18.91
18.10
6M Price Return
22.92
22.81
9M Price Return
16.66
15.61
YTD Price Return
23.14
23.08
1Y Price Return
16.68
15.63
3Y Price Return
19.01
18.21
5Y Price Return
30.41
32.70